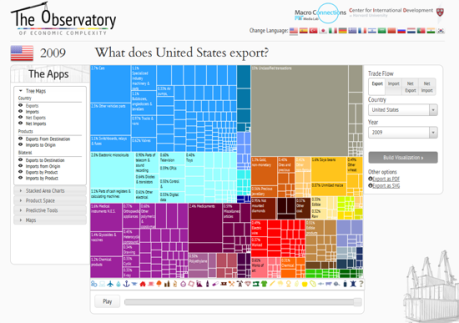
Instructional Artifact: The Observatory of Economic Complexity (Harvard University)
Description: The OEC is an interactive visualization of worldwide growth and development produced by Harvard University. As an instructional artifact, it is useful in both secondary and post-secondary civics courses that examine economics, production, and international business topics.
Learning Theories: Baddeley’s (2000) Model of Memory and Sweller’s (1998) Cognitive Load Theory both have applications within this artifact. The use of icons along the bottom of the main chart area coupled with matching color coding within the main chart area helps reduce cognitive processing by pairing the data and linking into the user’s prior knowledge (icons for visual representation).
Multimedia Models: From an information design standpoint, this is an excellent example of organizing to complement cognitive processes/internal organization through the use of simultaneously presenting words and pictures (Park & Hannafin, 1993; Mayer, 2001).
Mode Specific Guidelines: The use of a grid structure to organize and relate the percentage breakdown of individual components also signals a use of integration guidelines based upon Gestalt theory (Lohr, 2007). Selection guidelines are evident by the use of contrasting types, shapes, colors, and size of the individual components, which are related to Park and Hannafin’s principles 3, 7, and 9. Overall, the interactive display effectively combines a number of information design principles to produce a tastefully designed, yet informative instructional artifact.
Critique: From a numerical standpoint, the use of blocks to indicate size may actually increase cognitive load as users struggle to extrapolate meaning. Additionally, the colored blocks “jump” around the screen as the animation progresses in time. For example, the yellow blocks indicate crops. In one year, this cluster of exports are located on the far-right of the space, in the middle. However, in a subsequent year, these blocks are located in the upper left hand corner of the space. This creates a sort of cognitive dissonance, forcing the user’s attention in competing directions. It would be better if individual squares changed size, but remained in the same general area.
